Check it out! (link to full page)
.
Monday, December 11, 2017
City of Boulder Open Space & Mountain Parks Department's first Story Map!
Here it is! I have 3 more history hike narratives (written by Julie Johnson) to add to the map.
Tuesday, November 14, 2017
Close-range photogrammetry models of rock art (2/3)
Image processing and model stitching is progressing. I've been experimenting with subsetting models to maximize mesh face count and not exceeding available memory. Agisoft insists on calling subsets "chunks", which always makes me laugh as a millennial.
Here are some more recent uploads:
Head to my Sketchfab profile to see the rest and provide feedback! Stay tuned for outreach materials in the coming year.
Here are some more recent uploads:
Head to my Sketchfab profile to see the rest and provide feedback! Stay tuned for outreach materials in the coming year.
Sunday, September 3, 2017
Close-range photogrammetry models of rock art (1/3)
In fall 2016, Christian Driver and I began experimenting with close-range photogrammetry to document rock art. We help Boulder to manage rock art, specifically a series of 80+ rock art panel panels in eastern Boulder County. Many of the rock art panels in the area are too weathered to document or share satisfactorily with people. Since all of the currently detectable rock art is in relief, popular image transformations such as a principal components analysis or decorrelation are ineffective. Both of these processes are used to reduce autocorrelation (correlation of a signal with a lagged copy of itself) within a set of signals while preserving other (read: important) aspects of the signal.
- For explanation on how Dstretch works, read Dr. Ronald E. Alley's white paper. Before reading Dr. Alley's paper, I didn't realize that the Jet Propulsion Lab developed the algorithm used by Dstretch originally for ASTER, a 14-band multispectral sensor. I'm interested in learning more about how dramatically fewer data points in typical RGB camera sensors used for rock art change the dimensionality of the algorithm.
While the spectral information of the rock art itself is not sufficiently different than that of the surrounding rock to distinguish the rock art, the spatial information of the rock art is sufficiently different than that of the surrounding rock to distinguish it if you can capture it. Traditional rock art documentation was completed between 1984 and 1997 by the Indian Peaks chapter of the Colorado Archaeological Society (Kindig 1997). These recordings, while infinitely valuable for identification and relocation of panels, have a few limitations. They are not to scale, do not capture the type or method of rock art creation, do not capture condition or imminent threats (cracks, sloughing, vandalism, infiltration), and do not document the surrounding rock surface (texture, bedding, color, shape/volume). What data model maximizes production of these data for the least amount of time and cost? 3-dimensional or 3D models is a great start.
There are several ways to capture these 3D data, many of them are demonstrably "whiz-bang" as many of my bosses say. Terrestrial laser scanners are the fastest and most expensive method we found, which maximizes spatial extent and spatial differences but is less effective in capturing spectral information. We focused on close-range photogrammetry for several reasons: it's fast, it's cheap (price of sufficient quality DSLR camera (thanks Christian!), lenses (usually 50mm), and software unless open source), spectral, spatial, textural data captures are sufficient resolution, and it's reproducible.
Check out some examples of our 3D models so far. The models are color balanced and to scale. Sometimes the spatial extent of data capture is limited by our computer processing capacity. I'm hoping to experiment with parallel processing/RAM and processor upgrades in the next few months.
Please leave me comments on either this page or Sketchfab if you enjoy seeing the models, what you did and did not like about the models, and any changes you suggest.
-------------------------------------------------------------------------------------------------------------
Oil derrick
"Kirkendoll"
"WFM/ 1904"
Friday, March 31, 2017
DATA SHARE: Boulder local landmarks, historic districts, State and National Register listed resources
As part of a new planning effort at work, I assembled geospatial data for designated historic properties in City of Boulder and its public lands (45,000 acres surrounding Boulder, Colorado). These data were aggregated from:
- City of Boulder historic landmarks and districts (excluding contributing elements and potential districts),
- Boulder County historic landmarks,
- Boulder County historic districts and cultural landscapes,
- Colorado State Register of Historic Places-listed properties,
- National Register of Historic Places-listed properties, and
- National Historic Landmarks.
You can download this zip file, which contains an ESRI Layer Package file and accompanying shapefile of assembled info. The EPSG is 2876. Metadata is FGDC compliant and documents data sources, limits, and processing. Tabular data include designation type, parcel number, resource name.
NOTE: These data do not include protected information and are publicly available from their respective sources (City of Boulder, Boulder County, Colorado Office of Archaeology and Historic Preservation, and National Park Service).
Thursday, February 2, 2017
Saving Places 2017 Presentation
In February 2017, I presented at Colorado Preservation Inc.'s Saving Places Conference about using geospatial data to study linear cultural resources. The slideshow is accessible here for those looking for geospatial data (remotely sensed particularly) sources as promised.
This presentation was prompted by a paucity of evidence from existing and free geospatial data in cultural resource management reports and resource forms. Given the deposition context of the Front Range of Colorado where you can find both prehistoric and historic components on the ground surface, CRM archaeologists are missing out on time efficient and defensible data sources for resource documentation. Linear resources especially benefit from a geospatial approach because they're usually often difficult to record in entirety and assess segment contribution to overall resource eligibility to the National Register of Historic Places and a geospatial approach gives the CRM archaeologist basic lines of evidence to generate recommendations based on integrity (NPS Guidelines on Evaluating Integrity).
My goal for this presentation was to give the audience questions to ask of existing geospatial data to inform evaluations of cultural resource integrity and historic significance. The questions increase in specificity from broad (What is my geographic area of interest?) to pointed (Have design, setting, associations changed?) to concurring data (Do multiple sources agree?). I show examples from my own work in Boulder featuring:
Feel free to contact me with questions about the materials. I'm always happy to help people get the most out of their time and money/free data.
-Katy
This presentation was prompted by a paucity of evidence from existing and free geospatial data in cultural resource management reports and resource forms. Given the deposition context of the Front Range of Colorado where you can find both prehistoric and historic components on the ground surface, CRM archaeologists are missing out on time efficient and defensible data sources for resource documentation. Linear resources especially benefit from a geospatial approach because they're usually often difficult to record in entirety and assess segment contribution to overall resource eligibility to the National Register of Historic Places and a geospatial approach gives the CRM archaeologist basic lines of evidence to generate recommendations based on integrity (NPS Guidelines on Evaluating Integrity).
My goal for this presentation was to give the audience questions to ask of existing geospatial data to inform evaluations of cultural resource integrity and historic significance. The questions increase in specificity from broad (What is my geographic area of interest?) to pointed (Have design, setting, associations changed?) to concurring data (Do multiple sources agree?). I show examples from my own work in Boulder featuring:
- spectral information using multispectral aerial imagery with band indices,
- texture using high spatial resolution panchromatic satellite imagery,
- historic-age maps (from Civilian Conservation Corps in Boulder, 1935),
- LiDAR point clouds,
- LiDAR digital elevation models (DEM),
- LiDAR digital surface models (DSM), and
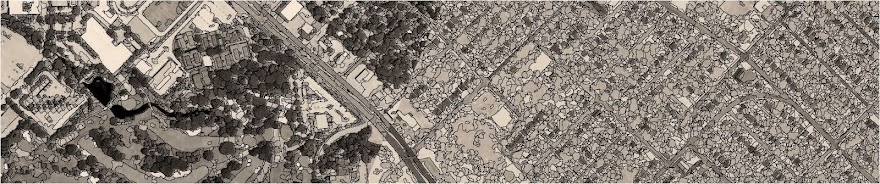
- change detection using panchromatic historical orthorectified and oblique aerial imagery (partial example below).
Feel free to contact me with questions about the materials. I'm always happy to help people get the most out of their time and money/free data.
-Katy
Subscribe to:
Posts (Atom)